Since 2008, our team at COLUMBIA Technologies has supported site managers in evaluating petroleum contamination at 125 and growing projects using direct sensing or imaging tools. These projects include a wide-range of application from gasoline and diesel fuel retail stations to Superfund sites, as well as petroleum terminals, petroleum storage facilities, pipeline terminals, railyards, oil refineries, complex underground storage tank (UST) sites, military installations, and truck refueling facilities. These sites have spanned across 28 states in the United States including Hawaii, and multiple provinces in Canada. One primary technology deployed at these sites is the Laser Induced Fluorescence, specifically LIF-UVOST® to determine the LNAPL distribution at these facilities. These experiences have provided us with a number of lessons learned about accurately, rapidly, and cost-effectively characterizing these sites using this technology.
First and foremost, the LIF-UVOST® technology enables site managers to rapidly, accurately and cost-effectively determine the in-situ distribution of residual petroleum NAPL. The cost-effectiveness of the tool is particularly noteworthy when one considers the large three dimensional geospatial volume of uncertainty in which most NAPL distributions exist. Hands down, this direct sensing technology does this better than other approaches such as evaluating soil cores from a limited number of locations. Why? Because the tool only responds to residual materials containing polycyclic aromatic hydrocarbons (PAHs) and does so with thousands of continuous data points in real time. This enables site managers to adjust their investigation plan hourly, providing more and more accurate information for less cost than drilling blind and waiting for lab results.
Secondly, the technology focuses on the actual in-situ NAPL thickness as measured by direct contact irrespective of the soil type, depth, or limitation of sampling screens. The risks of relying on product thickness in monitoring or extraction wells are well documented. LIF-UVOST® measures the actual in-situ product thickness without the risk of placing a sampling screen at the wrong depth.
A third advantage of the LIF-UVOST® technology is the ability to determine the distribution of different NAPLs in both the horizontal and vertical dimensions. Each unique PAH structure results in a unique fluorescence signature. The physical property provides clue to what type of product is being detected and in many cases the relative age of the detected product. This invaluable information can be used to separate individual sources, indicate as to whether spills are mature or relatively recent, and optimize remediation strategies to focus on the correct depths, contaminant makeup, and choice of remediation technology.
A fourth important lesson is that NAPL distribution may well not follow the distribution and direction of groundwater flow. While this understanding has been documented in other literature, a bias toward perceived groundwater flow direction permeates many sampling plans and monitoring or extraction well installations. Seeing in-situ NAPL distribution in high resolution in real time often elicits an “ah-ha” response. Lesson learned: NAPL spills flow first where the stratigraphy allows it to flow. Once in equilibrium in the pore spaces, then fate and transport including groundwater flow and biological activity can come to bear.
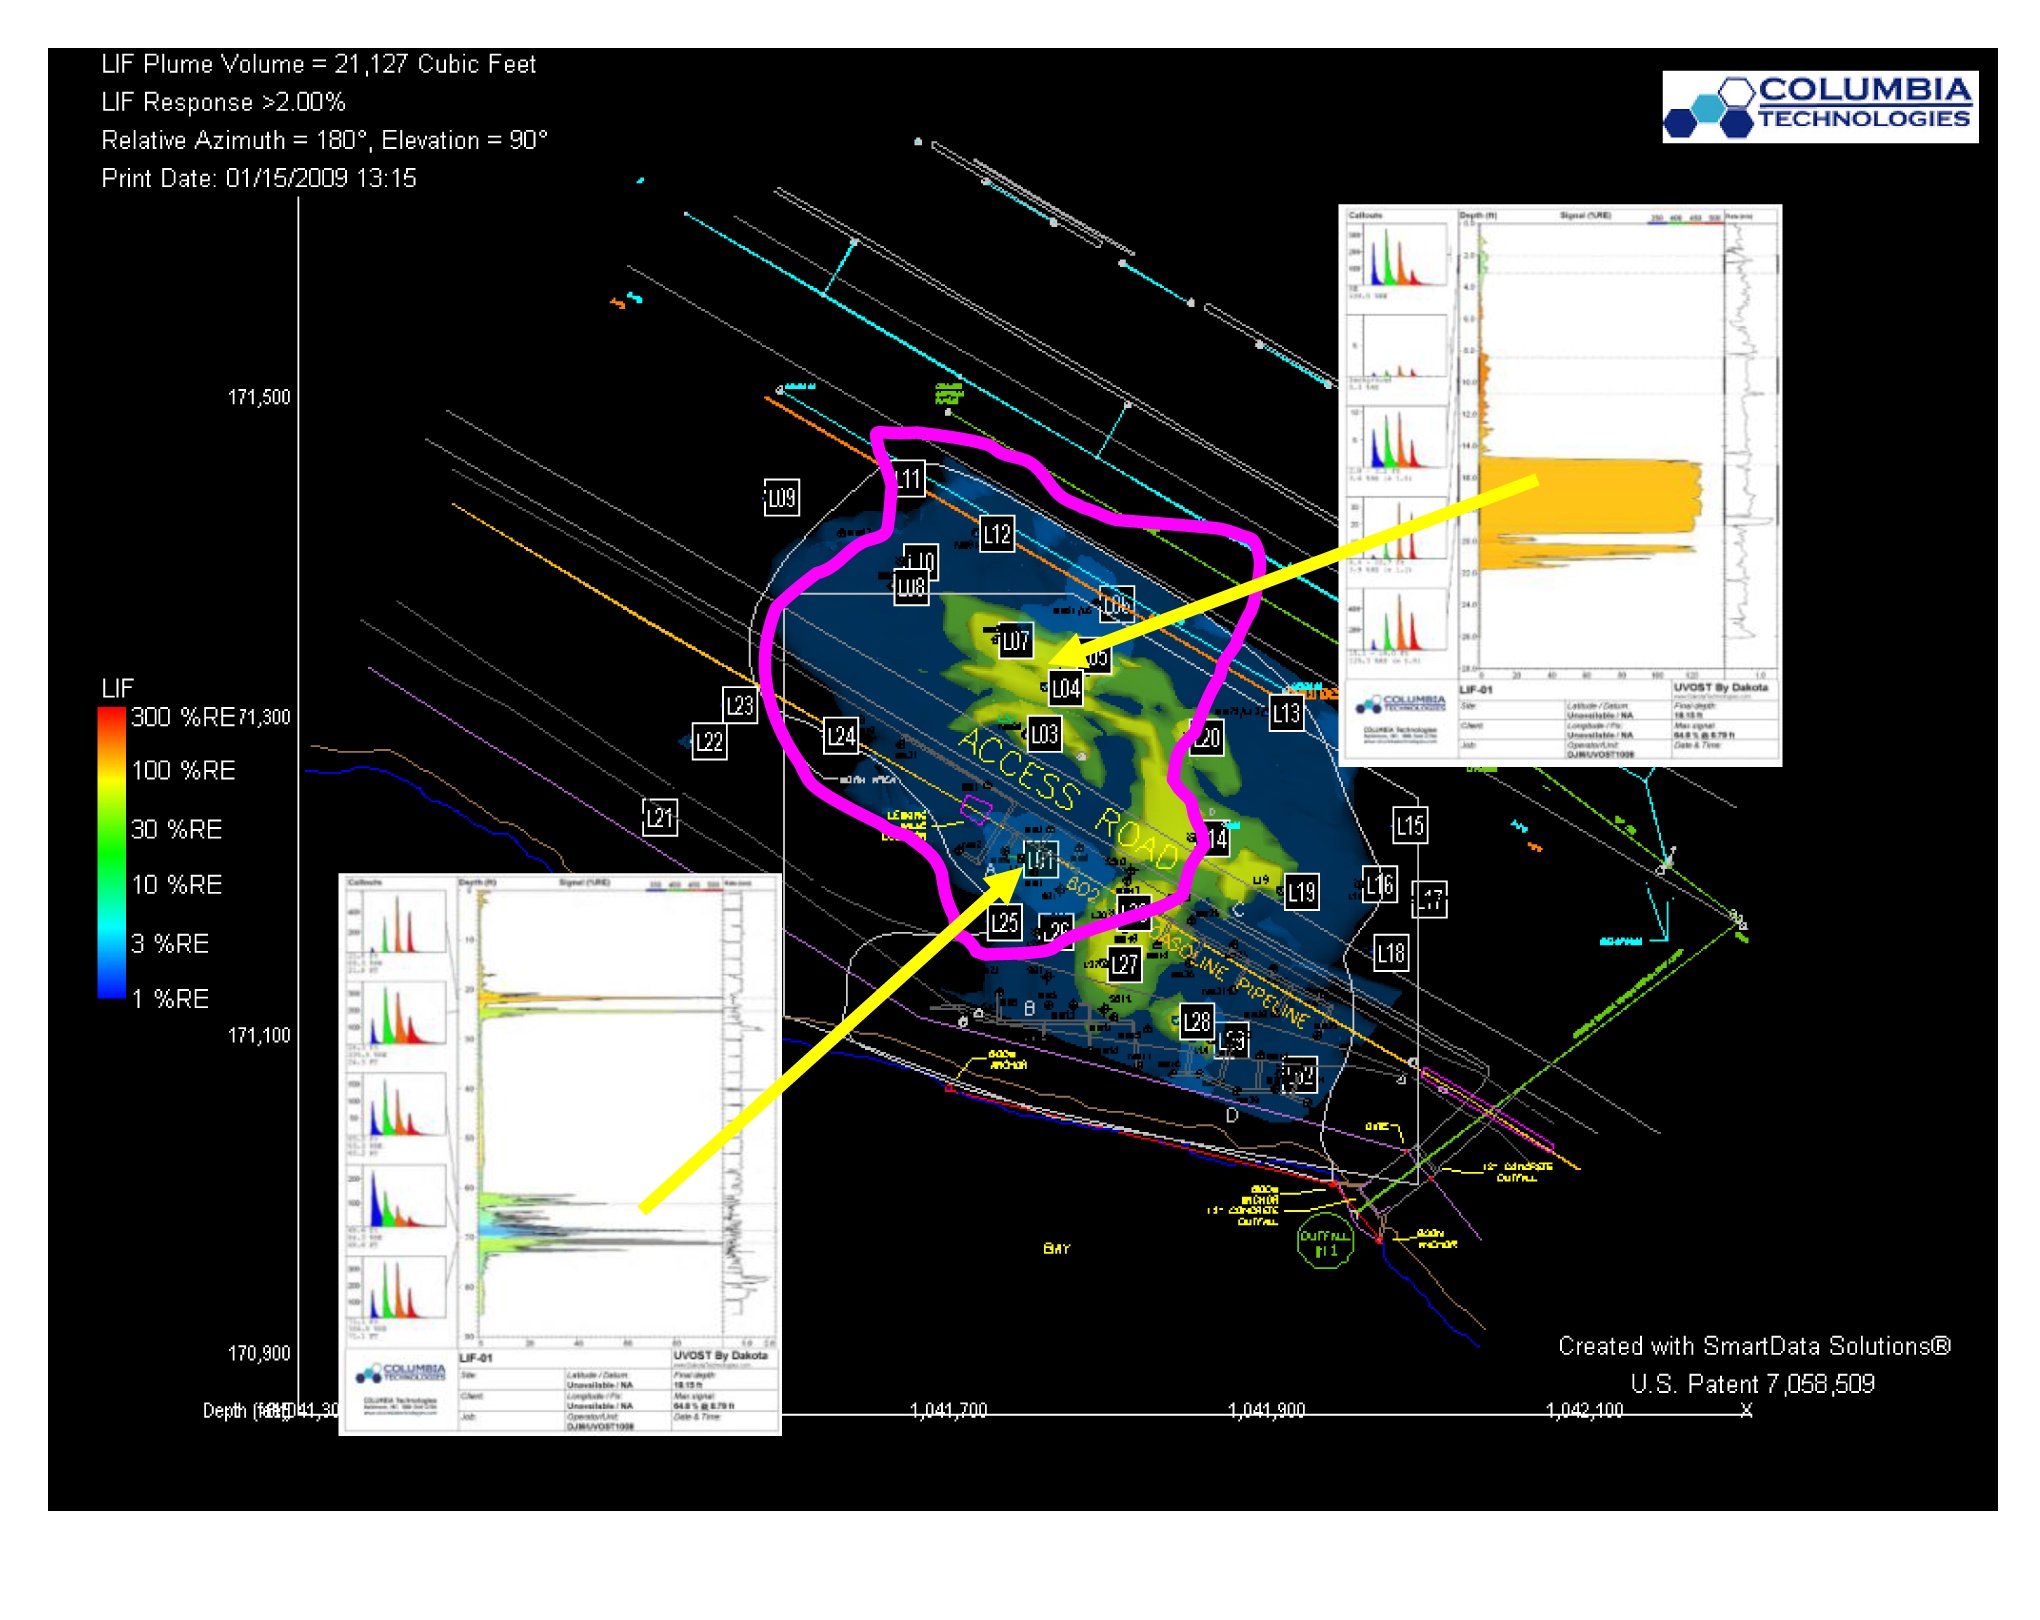
 An example where LIF-UVOST® technology was successfully deployed, is a case study at a former petroleum terminal facility. This project involved a bulk terminal with decades of operation and multiple acres with adjoining similar facilities and railroads. The site investigation and remediation activities to date included:
- Several types of subsurface hydrocarbon (weathered gasoline, kerosene, and weathered diesel)
- Multiple potential sources from adjoining properties
- A 20 year pump and treat system operating onsite
- A previous consent decree to obtain hydraulic control and semi-annual monitoring
- Sample results from the center of the site at above risk-based screening levels
- Well locations installed for over 20+ years
At this site, our direct sensing technologies were applied to NAPL thickness across the majority of the site, which is fairly common at many LIF-UVOST® projects. The initial investigative phase for this project included defining the vertical and horizontal extent of LNAPL impacted soils (source zone) across the site and then confirming the results with laboratory analysis at select locations. As the investigation continued, we were able to delineate the areas with greater uncertainty and bound the contaminated body to determine the extent of the plume. With each fuel having different characteristic fluorescence signatures we were then able to separate the multiple sources and distinguish the several types of subsurface hydrocarbon. Not only did this rapid investigation provide our client with a near complete site characterization in a single mobilization but it focused on the strategy and endgame of determining a remedial design plan to move forward with disposition of the site.
Combining different direct sensing tools provides a greater level of details and therefore creates multiple lines of evidence. For LNAPL projects, introducing the Hydraulic Profiling Tool (HPT) to a LIF survey allows for one to characterize the site's soil hydraulic properties in continuous high resolution to determine migration pathways, potential remediation injection zones, and accurate placement for monitoring or extraction wells in addition to understanding the LNAPL distribution. A better characterization on the local site geology, a more in depth understanding of the hydrology, and deeper insight into the contaminant chemistry of your site will allow you to make more informed remediation focused decisions.
While these are just a few of the lessons learned it has been clear so far that deploying LIF-UVOST® technology to determine the LNAPL distribution plays an integral role in moving forward with property transfers, regulatory action, as well as site closure.
Are there sites which you’re currently working on where an accurate delineation of the LNAPL distribution would help you move forward in achieving your overall objective? If so, go ahead and contact us to further discuss your project details.


